Visualization in Molecular Biology - JKU - 2013
Molecular biology has been going through a significant transformation from a predominantly wet-lab based science to an increasingly computational science. The development of powerful data acquisition methods such as next-generation sequencing allows unprecedented insight into the processes underlying all living things with the potential to revolutionize not only our understanding of these fundamental processes but also to change the way in which we treat diseases.
In this lecture we will discuss current and future approaches that address this shift to a data-driven science using visualization. We will discuss the various data sources and types and the appropriate visualization techniques. The lecture has a hands-on component where students are expected to develop visualization solutions in small teams. After this course students will not only understand the challenges of visualizing biological data, but will also be able to design visualizations on their own.
Contents
The course consists of 8 lectures plus two private meetings (one in person, one online) with the instructor for every group. The lectures cover an introduction to molecular biology, introduction to visualization and then go into details on sub-fields of visualization in molecular biology. In addition the course will contain interactive components such as design critiques of existing visualizations as well as sketching and design exercises.
Students are expected to complete the mandatory readings by the start of the lecture on the day the reading is due. Please make sure that you complete the readings since we will discuss it in the lecture.
You will be graded based on your participation in the class (30% of your grade; participation consists of attendance, participation in discussions and demonstrated knowledge of the readings) and on your project (70% of your grade).
It is possible to audit this class, i.e., to participate without being graded. Auditors do not have to submit a project but are expected to complete the readings and participate in the in-class exercises.
Project
The most essential part of this lecture is that you apply the skills taught to a practical project. For your project we will use a user-driven approach where I "play" an expert user. You are expected to interview the user, come up with multiple designs for a visualization solution, write up a project proposal and implement two iterations of your projects. Occasionally I will "break character" and give you advice and feedback on your design.
You are encouraged to work in teams of up to three students. You can choose the tools (languages, libraries) to implement your project freely. I recommend to create web-based visualizations using, for example D3, but this is not required. You may also use Caleydo, the visualization platform that is developed as a collaboration of JKU, TU Graz and Harvard. Another alternative is Processing, a language based on Java for easily developing graphical programs.
You must keep a process book which tells the story of your project from its beginning to the final design. Equally important to your final results is how you got there! Your process book is the place where you describe the space of possibilities you explored at each step of your project. It is not, however, a journal or lab notebook that describes every detail - you should think carefully about the important decisions you made and insights you gained and present your reasoning in a concise way. Your process book should include all your sketches, the evolution of your design (what alternatives did you consider?), your proposal, a description of your final solution and information on insights you gained from the data. Here are a couple of examples of good process books.
Here is a tentative list of potentially interesting topics.
- Protein Sequence - finding mutations in protein sequence that break function (the BioVis contest)
- Pathway Comparison - visualize differences between pathways of two species.
- Pathway Drug Augmentation - visualize binding sites and targets of drugs as well as similarity of drugs to each other.
- Protein Interaction Network - visualize a subset of a protein interaction network based on an input set of genes.
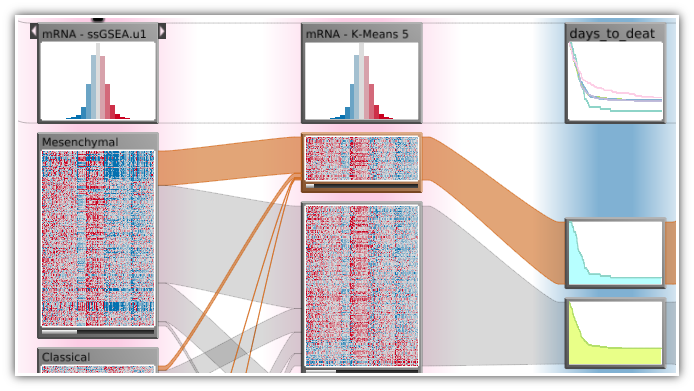
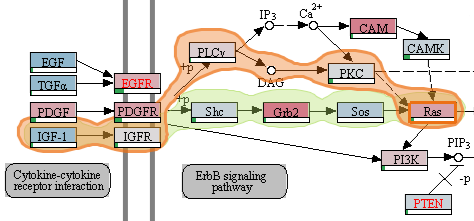
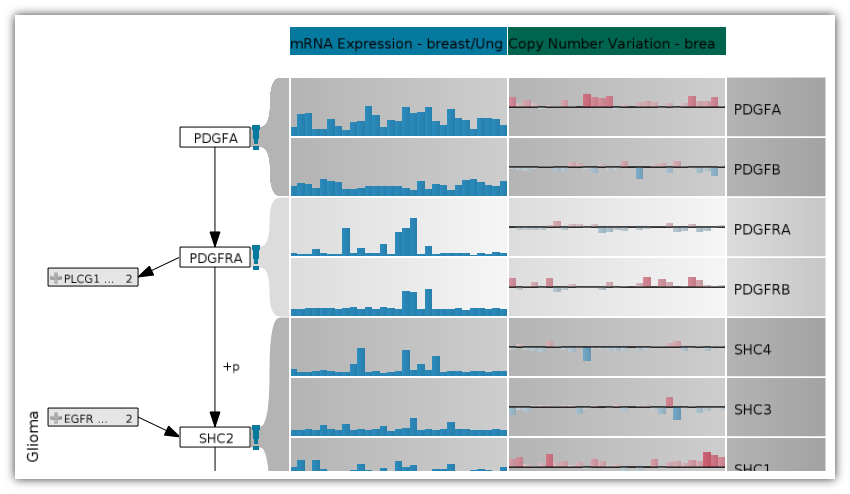
- Omics Data - visualize interrelationships of copy-number, mRNA expression and mutation data for significantly altered sources.
You will have to elicit more information by interviewing your "user". Your user will also provide you with initial data or point you to the relevant sources, but you might want to add additional data. You can also suggest other data sources or topics!
If you are interested you have the option of submitting your project to the IEEE BioVis contest. Accepted entries will be published in the proceedings of IEEE BioVis. The winners will receive a time-slot to present their work at IEEE VisWeek and an invitation to publish a full paper.
Exercises
Design Critiques
In design critiques, you will critique a visualization and identify design elements of visualizations that support analysis and communication. By the end of the activity you should feel ready to share your observations and questions with the class. Use these questions to guide you:
- Who is the intended audience?
- What tasks does the visualization enable?
- What data is represented in this visualization? Be specific.
- How is each data type visually encoded?
- How do the visual elements and user interactions support the tasks?
- Why do you like / dislike this visualization?
Lecture 1: Design Critique
Look at this visualization by the New York Times and discuss the questions listed above in small groups.
Lecture 2: Data Types
Look at this data file. What types of data can you observer?
Lecture 2: Design Critique
Another NYT Visualization
Lecture 3: Visualizing Inhomogeneous Data
You were approached by engineers of the Harvard Wyss Institute who develop artificial heart muscle tissue out of stem cells. They have succeeded in producing first prototypes using a new method and would like to understand what distinguishes their prototype form a real heart muscle and from another artificial reference. To do that they have collected 84 parameters of various types. The majority is gene expression data of a selected set of genes, but the others are physical, morphological or other properties such as contractility or electrophysiology. To understand and communicate their data they would like to visualize it in an intuitive way. However, initial tries of doing so did not produce the desired result.
It is your task to download the data and produce a meaningful visualization that can be used to compare the three different heart tissues. You can use simple tools like Excel or Tableau, but you are free to use whatever you like.
We will discuss your solutions and a sample solution made with Excel in class (at the beginning of Lecture 4). Please send me one or two screenshots of your visualization no later than one hour before class so I can show them in class. Be prepared to comment on you visualization.
Notice that the data has been anonymized.
Lecture 5: Redesign
Look at the figure that was contained in the paper available here. In a group of up to three people and analyze and critique the figure. Does it effectively convey the data it is supposed to show? Produce a redesign of the figure on paper that is more effective in communicating. Choose one member of your group to present your figure.
Lecture 7: Protein Interaction Visualization with Cytoscape
Download Cytoscape and (in teams of two) visualize this protein interaction network. Which layouts work and which don't? Pick your favourite and explain your choice to the class.
Schedule
The first lecture will take place in S2 0219, all following lectures will take place in S3 0346. The private meetings will take place in S3 0358.Lectures
You can download all slides here.Lecture 1: Class Logistics and Introduction to Visualization in Biology.
Lecture 2: Introduction to Visualization - Fundamentals
Reading due: Carpendale
Lecture 3: Introduction to Visualization - Basic Charts, Scales, Distributions
Reading due: van Wijk
Lecture 4: Introduction to Visualization - Composite Visualization and Multiple Coordinated Views
Lecture 5: Introduction to Biology, Genome Visualization (sequence visualization).
Reading due: Ledford
Supplementary Information on Molecular Biology
Lecture 6: Omics Visualization (mRNA, protein expression, etc.). Multi-dataset visualization.
Reading due: Weinstein
Lecture 7: Pathway and Network Visualization (biological processes)
Reading due: Saraiya et al (up to page 6)
Lecture 8: Visualizing phylogenetics (relationships between species), pedigrees and genealogy.
Reading due: Schulz
Lecture 9: Visualizing clinical data and patient records.
Mandatory Readings
Please complete these readings at the time stated in the schedule. You can access the papers here.- S. Carpendale, “Considering Visual Variables as a Basis for Information Visualisation,” University of Calgary, Department of Computer Science, Calgary, 2003.
- J. J. van Wijk, “Bridging the Gaps,” IEEE Computer Graphics and Applications, vol. 26, no. 6, pp. 6–9, 2006.
- H. Ledford, “Big science: The cancer genome challenge,” Nature, vol. 464, no. 7291, pp. 972–974, 2010.
- J. N. Weinstein, “A Postgenomic Visual Icon,” Science, vol. 319, no. 5871, pp. 1772–1773, 2008.
- P. Saraiya, C. North, and K. Duca, “Visualizing biological pathways: requirements analysis, systems evaluation and research agenda,” Information Visualization, vol. 4, no. 3, pp. 191–205, 2005. Read up to page 6, first column
- H.-J. Schulz, “Treevis.net: A Tree Visualization Reference,” IEEE Computer Graphics and Applications, vol. 31, no. 6, pp. 11–15, 2011.
Recommended Readings
- M. P. Schroeder, A. Gonzalez-Perez, and N. Lopez-Bigas, “Visualizing multidimensional cancer genomics data,” Genome Medicine, vol. 5, no. 1, p. 9, Jan. 2013.
- C. B. Nielsen, M. Cantor, I. Dubchak, D. Gordon, and T. Wang, “Visualizing genomes: techniques and challenges,” Nat Meth, vol. 7, no. 3s, pp. S5–S15, 2010.
- J. B. Procter, J. Thompson, I. Letunic, C. Creevey, F. Jossinet, and G. J. Barton, “Visualization of multiple alignments, phylogenies and gene family evolution,” Nature Methods, vol. 7, pp. S16–S25, Mar. 2010.
- S. I. O’Donoghue, D. S. Goodsell, A. S. Frangakis, F. Jossinet, R. A. Laskowski, M. Nilges, H. R. Saibil, A. Schafferhans, R. C. Wade, E. Westhof, and A. J. Olson, “Visualization of macromolecular structures,” Nature Methods, vol. 7, pp. S42–S55, Mar. 2010.
- N. Gehlenborg, S. I. O’Donoghue, N. S. Baliga, A. Goesmann, M. A. Hibbs, H. Kitano, O. Kohlbacher, H. Neuweger, R. Schneider, D. Tenenbaum, and A.-C. Gavin, “Visualization of omics data for systems biology,” Nature Methods, vol. 7, no. 3, pp. 56–68, 2010.
Project Group Peer Assessment
In the professional world, three important features affect your productivity and success: your own effort, the effort of people you depend on, and the way you work together. For this reason we have chosen a team-based approach that values all three of those features. After the project you will provide an assessment of the contributions of the members of your team, including yourself. Your scores on the projects are adjusted up or down depending on the following factors:
- Your teammates’ view of your contributions to the team
- The accuracy of your own assessment of your contributions
- The accuracy of your assessment of each of your teammates’ contributions
Collaboration Policy, Quoting Sources
Because teamwork is stressed in this class, collaboration, consulting information sources, and working with others is permitted. Please note the following restrictions, however.
You may not submit the same or similar work to this course that you have submitted or will submit to another.
You must acknowledge any source code that was not written by you by mentioning the original author(s) directly in your source code (comment or header). You can also acknowledge sources in a README.txt file if you used whole classes or libraries. Do not remove any original copyright notices and headers. However, you are encouraged to use libraries!
You may use examples you find on the web as a starting point, provided its license allows you to re-use it. You must quote the source using proper citations (author, year, title, time accessed, URL) both in the source code and in any publicly visible material. You may not use existing complex combinations or large examples. For example, you may not use a ready to use multiple linked view visualization. You may use parts out of such examples.
Credits and Copyright notice
Some of the material in this course is based on the material by Hanspeter Pfister, Marc Streit, Nils Gehlenborg, Hans-Joerg Schulz, Bang Wong, Christian Partl, Denis Kalkofen, Miriah Meyer, Tamara Munzner, Cidney Nielsen and Helwig Hauser. I have tried my best to give credit by linking to the original source. Please contact me if you find materials where the credit is missing or that you would rather have removed.
This course website, and much of the text, images, graphics, audio and video clips, and other content of the site (collectively, the “Content”), are protected by copyright law. In some cases, the copyright is owned by third parties, and Harvard is making the third-party Content available to you under the fair use doctrine. Fair use permits only certain limited uses of the Content.
Original content on this website including the slides are licensed under the the Creative Commons Attribution 3.0 Unported License.