Alexander Lex
interactive data visualization; human data interaction; visual data analysis for molecular biology Last update: 2016-08-30

I am looking for PostDocs and PhD students to join the Visualization Design Lab at the Scientific Computing and Imaging Institute and the School of Computing at the University of Utah. For the PostDoc position, please refer to this announcement. If you are interested in joining the lab as a graduate student, or if you have any other questions, write me at alex@sci.utah.edu.
I develop interactive data analysis methods for experts and scientists. My primary research interests are interactive data visualization and analysis especially applied to molecular biology and pharmacology. I concern myself with data analysis challenges that require human reasoning and human intervention. I like to think of my work as human data interaction, as interactive visualization, combined with algorithmic and statistical methods, make data accessible for human consumption.
I am a co-founder and leader of the Caleydo Project, which is both, software that can be used by life science experts to visualize biomolecular data and pathways, but also a platform for implementing prototypes of radical visualization ideas.
Bio
I am an Assistant Professor of Computer Science at the Scientific Computing and Imaging Institute and the School of Computing at the University of Utah. Together with Miriah Meyer, I run the Visualization Design Lab where we develop visualization methods and systems to help solve today's scientific problems.
Before that I was a lecturer and post-doctoral visualization researcher in Hanspeter Pfister's group at the Harvard School of Engineering and Applied Sciences. I received my PhD, Master's and undergraduate degrees from the Institute for Computer Graphics and Vision at the Graz University of Technology where I was advised by Prof. Dieter Schmalstieg. In 2011 I was a visiting researcher at Prof. Peter Park's Computational Genomics Research Group at Harvard Medical School.
I am on the organizing committee for IEEE Vis, BioVis and the Visualization in Data Science Symposium. I'm also on the program committee for InfoVis, PacificVis and EuroVis Short Papers. I review for a wide range of publications including IEEE TVCG, CG&A, ACM CHI, and BMC Bioinformatics.
Selected Research Projects
Check out more projects here
Pathfinder Pathfinder Paper Page
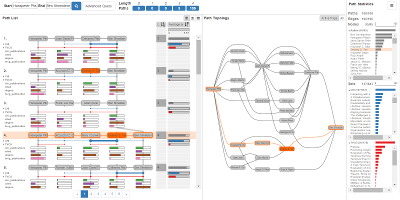
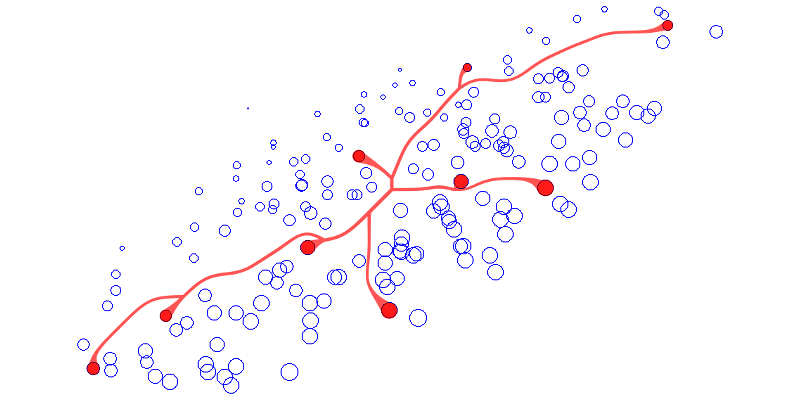
Pathfinder is a visualization technique for path-based analysis of large and multivariate graphs. It is designed for the exploration of graphs that are too large to visualize as a whole. Pathfinder leverages (potentially sophisticated) queries into the graph. It has a unique linear path layout, that makes it possible to visualize rich attribute data about the nodes and/or edges. Important paths are identified through dynamic ranking which can be based on both, topological features and attributes.
Vials http://vials.io
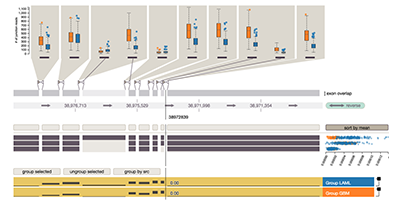
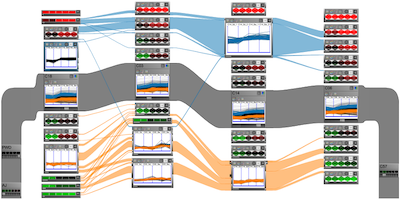
Vials helps expert to analyze alternative splicing data, as it is generated from mRNA Seq. Other vis techniques for splicing data typically don't scale to many experiments. Vials works well for hundreds of samples and makes it easy to compare groups of samples. It visualizes expression, estimated isoform abundances and the number of junction reads.
UpSet http://caleydo.org/tools/upset
UpSet is a visualization technique for set-based data. It was developed out of the desire to make set visualization scalable and efficient. Sets are often visualized with Venn and Euler diagrams, which are neither scalable nor are they good at communicating the underlying data. UpSet is a new approach to set visualization that uses efficient visual encodings for set sizes, intersection sizes and element attributes.
Students
I have supervised many student projects on all levels - PhD, bachelor's thesis, master project and master's thesis, at the University of Utah, Harvard, and at TU Graz. For a list of previous students go here.Current PhD Students
- Carolina Nobre | Social Networks
- Asmaa Aljuhani | Multidimensional Data
- Cameron Waller | Metabolic Networks [co-supervised with Jared Rutter]
- Christian Partl | Biological Networks [co-supervised with Dieter Schmalstieg]
Current Master's Students
- Brian Kimming | Heterogeneous Tables
- Sunny Hardasani | Survey Data
Looking for a Project?
Are you a student at the University of Utah looking for a visualization project? I'm always looking for students to work on web-based visualization and on projects in Caleydo. Just write me!
Publications
Peer Reviewed Publications
Pathfinder: Visual Analysis of Paths in Graphs - Honorable Mention Award
Computer Graphics Forum (EuroVis '16), vol. 35, no. 3, pp. 71-80, 2016.
From Visual Exploration to Storytelling and Back Again
Computer Graphics Forum (EuroVis '16), vol. 35, no. 3, pp. 491-500, 2016.
Vials: Visualizing Alternative Splicing of Genes
IEEE Transactions on Visualization and Computer Graphics (InfoVis ’15), vol. 22, no. 1, pp. 399-408, 2016.
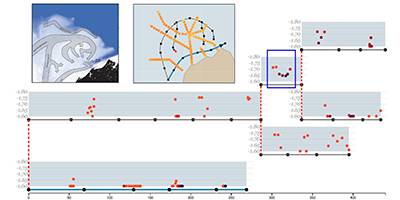
OceanPaths: Visualizing Multivariate Oceanography Data
Proceedings of the Eurographics Conference on Visualization (EuroVis ’15) - Short Papers
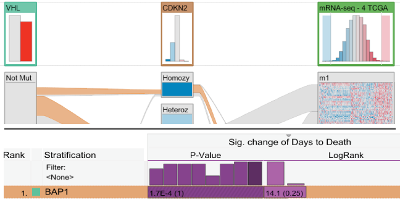
Guided visual exploration of genomic stratifications in cancer
Nature Methods, vol. 11, no. 9, pp. 884–885, 2014. *equal contribution
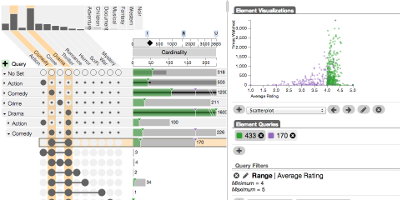
UpSet: Visualization of Intersecting Sets
IEEE Transactions on Visualization and Computer Graphics (InfoVis '14), vol. 20, no. 12, pp. 1983–1992, 2014.
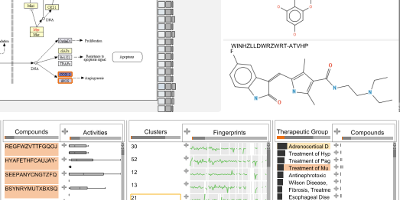
ConTour: Data-Driven Exploration of Multi-Relational Datasets for Drug Discovery
IEEE Transactions on Visualization and Computer Graphics (VAST '14), vol. 20, no. 12, pp. 1883–1892, 2014.
Domino: Extracting, Comparing, and Manipulating Subsets across Multiple Tabular Datasets - Honorable Mention Award
IEEE Transactions on Visualization and Computer Graphics (InfoVis '14), vol. 20, no. 12, pp. 2023–2032, 2014.
Show me the Invisible: Visualizing Hidden Content - Honorable Mention Award
In Proceedings of the SIGCHI Conference on Human Factors in Computing Systems (CHI ’14), pp. 3705-3714, 2014.
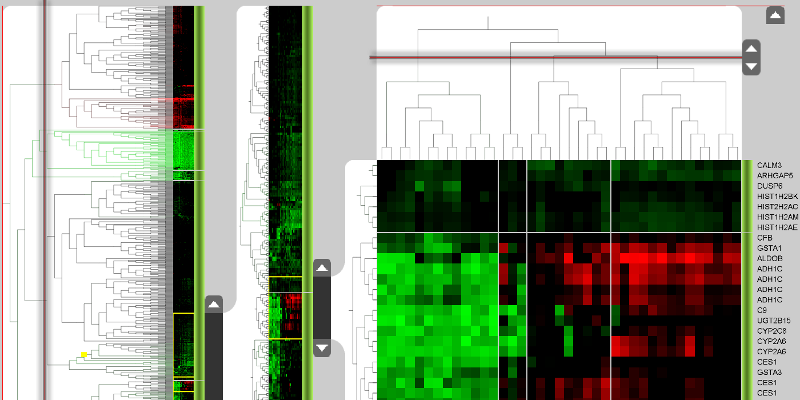
Characterizing Cancer Subtypes using Dual Analysis in Caleydo
IEEE Computer Graphics and Applications, 34(2), pp. 38–47, 2014.
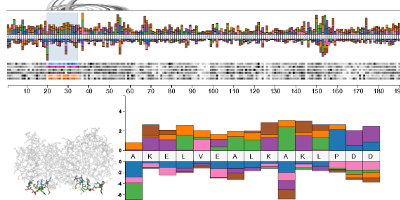
Mu-8: Visualizing Differences between Proteins and their Families
BMC Proceedings, vol. 8, no. Suppl 2, p. S5, 2014. *corresponding author
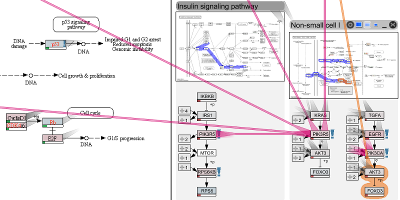
Entourage: Visualizing Relationships between Biological Pathways using Contextual Subsets
IEEE Transactions on Visualization and Computer Graphics (InfoVis '13), 19(12), pp. 2536–2545, 2013.
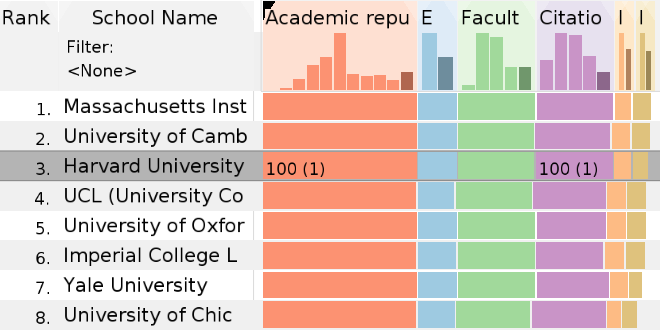
LineUp: Visual Analysis of Multi-Attribute Rankings - Best Paper Award
IEEE Transactions on Visualization and Computer Graphics (InfoVis '13), 19(12), pp. 2277–2286, 2013.
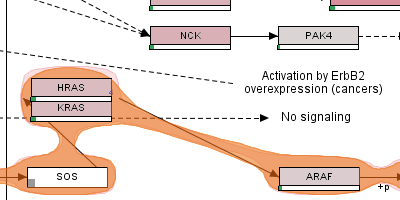
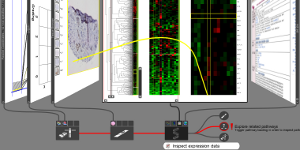
enRoute: Dynamic Path Extraction from Biological Pathway Maps for Exploring Heterogeneous Experimental Datasets
BMC Bioinformatics, 14(Suppl 19), p. S3, 2013
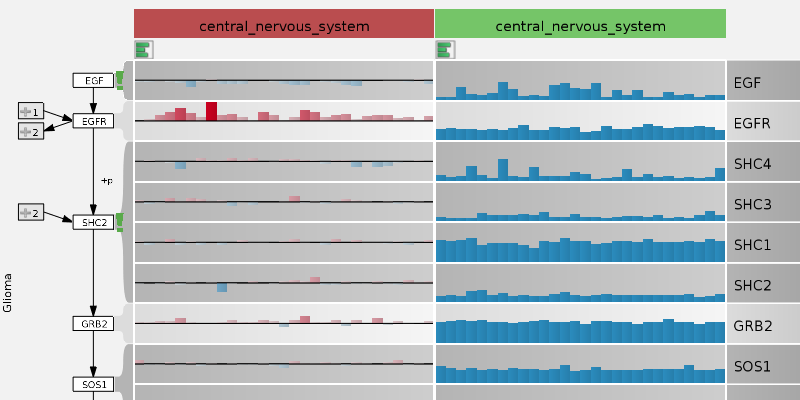
enRoute: Dynamic Path Extraction from Biological Pathway Maps for In-Depth Experimental Data Analysis - Best Paper Award
Proceedings of the IEEE Symposium on Biological Data Visualization (BioVis ’12), pp. 107–114, 2012
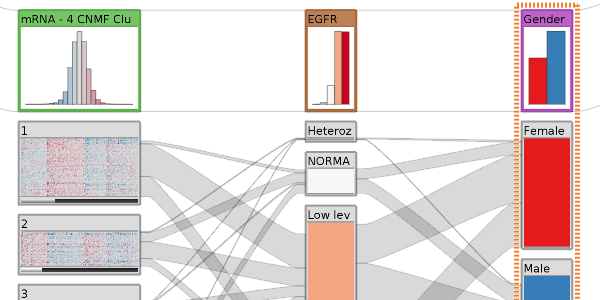
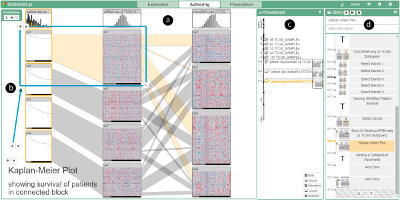
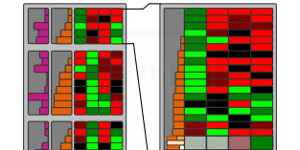
StratomeX: Visual Analysis of Large-Scale Heterogeneous Genomics Data for Cancer Subtype Characterization - 3rd Best Paper Award
Computer Graphics Forum (EuroVis '12), 31(3), pp. 1175-1184 , June 2012
Visualizing Uncertainty in Biological Expression Data
Proceedings of the SPIE Conference on Visualization and Data Analysis (VDA '12), pp. 82940O, 2012.
Model-Driven Design for the Visual Analysis of Heterogeneous Data
IEEE Transactions on Visualization and Computer Graphics, 18(6), pp. 998-1010, 2012.
VisBricks: Multiform Visualization of Large, Inhomogeneous Data
IEEE Transactions on Visualization and Computer Graphics (InfoVis'11), 17(12), pp. 2291-2300, Dec. 2011.
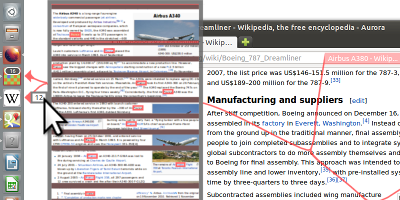
Context-Preserving Visual Links - Best Paper Award
IEEE Transactions on Visualization and Computer Graphics (InfoVis'11), 2249-2258, 17(12), Dec. 2011.
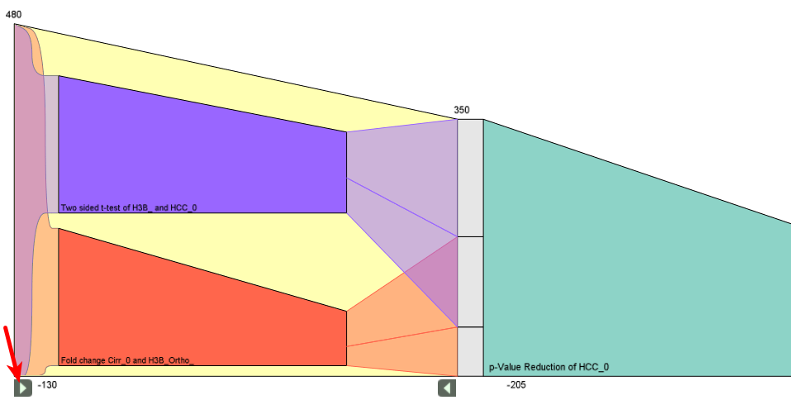
Visualizing the Effects of Logically Combined Filters
Proceedings of the Conference on Information Visualisation (IV’2011), pp. 47-52, London, UK, 2011.
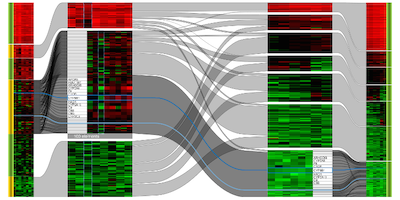
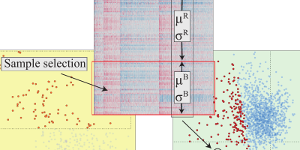
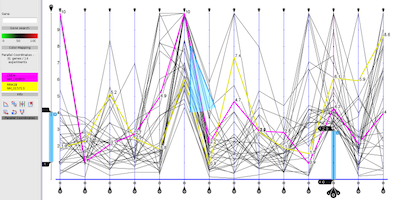
Comparative Analysis of Multidimensional, Quantitative Data
IEEE Transactions on Visualization and Computer Graphics (InfoVis'2010), 16(6), pp. 1027-1035, Nov.-Dec. 2010.
Visual Links across Applications - Best Student Paper Award
Proceedings of the Graphics Interface (GI) 2010, Ottawa, Ontario, Canada, May 31 - June 2 2010.
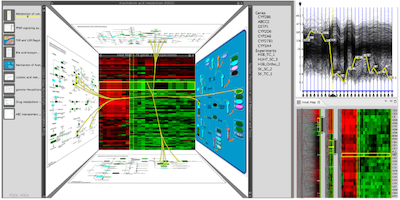
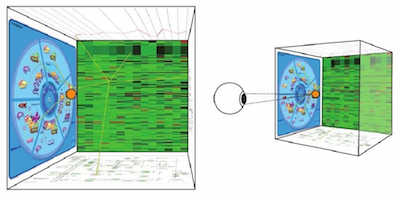
Caleydo: Design and Evaluation of a Visual Analysis Framework for Gene Expression Data in its Biological Context
Proceedings of 2010 IEEE Pacific Visualization Symposium, pp. 57-64, Taipeh, Taiwan, 2010.
Caleydo: Connecting Pathways with Gene Expression
Bioinformatics, Oxford Journals, 25(20), pp. 2760-2761, 2009.
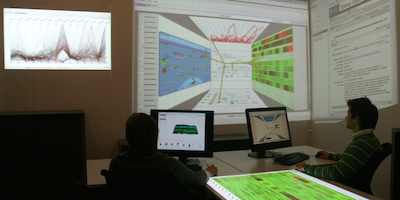
Design Considerations for Collaborative Information Workspaces in Multi-Display Environments
Proceedings of Workshop on Collaborative Visualization on Interactive Surfaces (CoVIS'09), at VisWeek, ISSN 1862-5207, pp. 5-8, Atlantic City, USA, 2009.
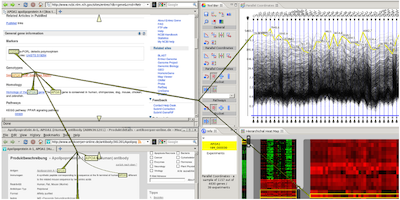
Connecting Genes with Diseases
Proceedings of the Symposium on Information Visualization in Biomedical Informatics, 13th International Conference on Information Visualization, Barcelona, Spain, July 2009.
Gaze-Based Focus Adaption in an Information Visualization System
IADIS Computer Graphics and Visualization and Image Processing 2009 Conference (CGVCVIP), Algarve, Portugal, June 2009.
Commentary
Thesis Papers
Doctoral Thesis
Title: Visualization of
Multidimensional Data with Applications in Molecular Biology
Advisor:
Prof. Dieter Schmalstieg
Co-Advisor: Dr. Nils Gehlenborg
Referee:
Prof. Robert Kosara
Publication date: March 2012
Master's Thesis
Title: Exploration of Gene
Expression Data in a Visually Linked Environment
Supervision:
Prof. Dieter Schmalstieg
Publication date: June
2008
Bachelor's Thesis
Title: Evaluation of
Medical Image Viewers and
Architectural Software
Design for a Medical Image Viewer
Supervision: Prof.
Horst Bischof /
Dr. Martin Urschler
Publication date: June 2005
Posters and Abstracts
Hendrik Strobelt, Bilal Alsallakh, Joseph Botros, Brant Peterson, Mark Borowsky, Hanspeter Pfister, and
Alexander Lex
A Novel Tool for Isoform Visualization.
Poster Proceedings of the 5th Symposium on Biological Data Visualization (BioVis'15), ISMB, Dublin, Ireland,
USA, 2015.
Alexander Lex, Nils Gehlenborg, Hendrik Strobelt, Romain Vuillemot, Hanspeter Pfister
UpSet for Visualizing
Intersecting Sets in Biology
Poster Proceedings of the 4th Symposium on Biological Data Visualization (BioVis'14), ISMB, Boston, MA, USA,
2014.
Christian Partl, Alexander Lex, Marc Streit, Hendrik Strobelt, Anne-Mai Wassermann, Hanspeter Pfister, Dieter
Schmalstieg
ConTour:
Data-Driven Exploration of
Multi-Relational
Datasets for Drug Discovery
Poster Proceedings of the 4th Symposium on Biological Data Visualization (BioVis'14), ISMB, Boston, MA, USA,
2014.
Marc Streit, Alexander Lex, Christian Partl, Dieter
Schmalstieg, Peter J. Park and Nils Gehlenborg:
StratomeX:
Guided Visual Exploration for Tumor Subtype Identification.
In The Cancer Genome Atlas' 2nd Annual
Scientific Symposium, Crystal City, VA, USA, 2012.
Alexander Lex, Marc Streit, Hans-Jörg Schulz, Christian
Partl, Dieter Schmalstieg, Peter J. Park, Nils Gehlenborg:
StratomeX:
Enabling Visualization-Driven Cancer Subtype Analysis
Poster Proceedings of the IEEE
Symposium on Biological Data Visualization (BioVis '12), 2012.
Marc Streit, Alexander Lex, Hans-Jörg Schulz, Christian
Partl, Dieter Schmalstieg, Peter J. Park, Nils Gehlenborg:
Guided Visual Analysis for the Identification of Cancer Subtypes
The Cancer Genome Atlas’ Semi-Annual Steering Committee Meeting,
Houston, TX, US, 25-27 April 2012.
Alexander Lex, Marc Streit, Hans-Joerg Schulz, Christian
Partl, Dieter Schmalstieg, Peter J. Park, Nils Gehlenborg:
StratomeX -
Integrative Visualization of Tumor Subtypes in Cancer Genomics
Data Sets
Visualizing Biological Data (VIZBI) 2012,
Heidelberg, Germany
Alexander Lex, Peter J. Park and Nils Gehlenborg:
Supporting
Subtype Characterization through Integrative Visualization of
Cancer Genomics Data Sets
The Cancer Genome Atlas’ 1st
Annual Scientific Symposium: Enabling Cancer Research Through TCGA,
November 17-18, 2011, Washington, D.C., USA
Marc Streit, Alexander Lex, Helmut Doleisch and Dieter
Schmalstieg:
Does
software engineering pay off for research? Lessons learned from
the Caleydo project.
Proceedings of the second
Eurographics Workshop on Visual Computing for Biology and Medicine
(VCBM), Leipzig, Germany, July 1 - 2 2010.
Gudrun Schmidt-Gann, Katharina Schmid, Monika Uehlein,
Joachim Struck, Andreas Bergmann, Dieter Schmalstieg, Marc Streit,
Alexander Lex, Douw G. van der Nest, Martijn van Griensven and
Heinz Redl:
Gene- and Protein Expression Profiling
in Liver in a Sepsis-Baboon Model
32nd Annual Meeting on
Shock, San Antonio, Texas, 2009.
CALEYDO
Marc Streit, Alexander Lex, Dieter Schmalstieg, Heimo
Mueller, Stefan Sauer, Wilhelm Steiner, Kurt Zatloukal
ZMF.Day (Center for Medical Research), Graz, Austria, 2008.
Tutorials
StratomeX & enRoute: Integrative Visualization with Caleydo
Nils Gehlenborg and Alexander Lex
Visualizing Biological Data
(VIZBI) 2013, Cambridge, MA, USA, 2013-03.
Cancer Data Analysis with Caleydo StratomeX and enRoute
Alexander Lex and Marc Streit
Symposium on Understanding Cancer
Genomics through Information Visualization
Tokyo
University, Tokyo, Japan, 2013-02.
Connecting the Dots – Showing Relationships in Data and Beyond
Marc Streit, Hans-Jörg Schulz and Alexander Lex
VisWeek’12,
Seattle, WA, USA, 2012-10.
Talks
Pathfinder: Visualizing Paths in Graphs
BioVis @ ISMB, Orlando, FL, USA, 2016-07-08.
Enabling Discovery through Interactive Visual Data Analysis
Marth Lab, Salt Lake City, UT, 2016-08-25
Pacific Northwest National Laboratory, Richland, WA, 2016-07-1
Huntsman Cancer Institute, Salt Lake City, UT, 2016-03-30
Camp Lab, Salt Lake City, UT, 2015-11-23
UpSet: Visualization of Intersecting Sets
Data Ventures, Harvard University, Cambridge, MA, USA,
2015-04-23.
BioIT World Conference & Expo, Boston, MA, USA, 2015-04-22.
Paper presentation at IEEE InfoVis, Paris,
France, 2014-11-03.
Tufts University, Sommerville, MA, USA, 2014-10-29.
Enabling Scientific Discovery through Interactive Visual Data Analysis
University of Vienna, Vienna, Austria, 2015-08-07.
Adobe Research, San Francisco, CA, USA, 2015-04-06.
EPFL, Lausanne, Switzerland, 2015-03-26.
University of Utah, Salt Lake City, UT, USA, 2014-12-03.
University of St. Andrews, St. Andrews, Scotland, 2014-11-03.
Visual Data Analysis for Biology and Pharmacology
PerkinElmer, Boston, MA,
USA, 2014-11-05.
Novartis Institutes for BioMedical Research, Cambridge, MA,
USA, 2014-07-09.
Visualizing Relationships between Biological Pathways
Drug Discovery on Target Conference, Boston, MA, USA,
2014-10-08.
BioIT World Conference
& Expo, Boston, MA, USA, 2014-05-01.
DBMI, Harvard Medical
School, Boston, MA, USA, 2014-04-17.
Visualizing Multi-Attribute Rankings & A Very Short Visualization Introduction
Harvard Graduate School of Education, Strategic Data Project, Cambridge, MA, USA, 2014-03-07.
Visualization Approaches for Biomolecular Data
Georgia Tech, School of Interactive Computing,
Atlanta, GA, USA, 2014-04-08
University of Calgary, Department of Computer Science, Calgary, AB,
Canada,
2014-02-13.
MIT CSAIL, Cambridge, MA,
USA. 2013-04-12.
UMass
Lowell, Lowell, MA, USA, 2013-11-06.
Data Visualization in Molecular Biology.
Novartis Institutes for BioMedical Research, Cambridge, MA, USA, 2013-07-29.
enRoute: Dynamic Path Extraction from Biological Pathway Maps for Exploring Heterogeneous Experimental Datasets
BioIT World Conference
& Expo, Boston, MA, USA, 2013-04-10.
Visualizing Biological Data
(VIZBI) 2013, Cambridge, MA, USA, 2013-03-20
Symposium on Understanding Cancer
Genomics through Information Visualization at Tokyo University,
Tokyo, Japan. 2013-02-22.
StratomeX: Visual Analysis of Large-Scale Heterogeneous Genomics Data for Cancer Subtype Characterization
IEEE BioVis 2012, Seattle,
Washington, USA. 14.10.2012
EuroVis 2012, paper
presentation, Vienna, Austria, 2012-06-07.
VisBricks: Multiform Visualization of Large, Inhomogeneous Data
IEEE InfoVis 2011, Providence, Rhode Island, USA. Paper presentation, 2011-10-26.
Visualizing Biomolecular Data with the Caleydo Framework
CBMI, Harvard Medical
School, Boston, MA, USA, 2011-08-12.
MRC Laboratory of
Molecular Biology (LMB), Cambridge, UK, 2010-09-21.
European BioInformatics Institute
(EBI), Cambridge, UK, 2010-09-20.
Visualizing the Effects of Logically Combined Filters
Information Visualization 2011, London, UK. Paper presentation, 2011-07-14.
Comparative Analysis of Multidimensional, Quantitative Data
IEEE InfoVis 2010, Salt Lake City, Utah, USA. Paper presentation, 2010-10-28.
Caleydo: Visual Analysis of Biomolecular Data
VCBM 2010 Leipzig, Germany, 2010-07-02.
Caleydo and Visual Links
VRVis Research Company, Vienna, Austria. 2010-03-11
Caleydo: Design and Evaluation of a Visual Analysis Framework for Gene Expression Data in its Biological Context.
PacificVis 2010, Taipei, Taiwan. Paper presentation, 2010-03-03.
Caleydo: Visualization of Gene Expression Data in the Context of Biological Processes
AUVA Research Center for Traumatology, Vienna, Austria, 2009-02-26.
Novel InfoVis Techniques Applied to Pathways and Gene Expression Data
Institute for Genomics and Bioinformatics, Graz University of Technology, Austria, 2008-07-10.
Teaching and Student Projects
Courses at the University of Utah
CS-5630/CS-6630 - Visualization (2015, 2016)
Instructor.
Graduate/undergraduate course on data visualization. Visualization literacy, visualization critique,
perception, data acquisition and cleanup, interaction, information visualization, and scientific visualization.
CS 5963 / MATH 3900 - Introduction to Data Science (2016)
Co-Instructor.
An introduction to computational and statistical methods for non-CS students.
Courses at Harvard University
CS 171 - Visualization (2015)
Instructor.
Undergraduate level lectures on
visualization. Visualization literacy, visualization critique,
perception, data acquisition and cleanup, interaction.
CS 171 - Visualization (2013, 2014)
Head teaching fellow. Taught by Hanspeter Pfister.
Co-developed class, taught multiple lectures
and supervised 15 teaching fellows.
CS 109 / AC 209 / Stat 121 / E-109 - Data Science (2013)
Teaching fellow. Taught by Hanspeter Pfister and Joe
Blitzstein.
Undergraduate and graduate lecture on data analysis
using statistics, machine learning and visualization.
Courses at TU Graz
Selected Topics Computer Graphics (2011/2012, 2010/2011)
Co-Instructor.
Lectures on
Perceptional Issues, Color, Information Visualization, Visual
Analytics, Flow Visualization.
Distributed Systems (2011/2012, 2010/2011, 2009/2010)
Teaching assistant.
Development and
supervision of lab assignments.
Introduction to Scientific Work (2011/2012, 2010/2011)
Teaching assistant.
Supervision of
focus groups.
Teaching assistant.
Development and supervision of lab
assignments.
Teaching assistant.
Development and supervision of lab
assignments.
Guest Lectures
Blocked guest lecture (9 lectures) at Johannes Kepler University, Linz, Austria. 2013. Sponsored by an "Excellence in Teaching" scholarship awarded by the state of Upper Austria. Graduate level lecture on visualization for molecular biology.
Fundamentals of Visual Data Encoding
Guest lecture for CS 179: Design of Usable
Interactive
Systems, Prof. Krzysztof Gajos
Harvard University, Cambridge, MA, USA, 2014-02-26.
Press Coverage
Here is a list of selected newspaper or magazine articles and press releases that are either about my work, or are pieces where I was interviewed.
The OpenHelix Blog, 2016:
Video Tip of the Week: Pathfinder, for exploring paths through data sets
The OpenHelix Blog, 2014:
Video Tip of the Week: UpSet about genomics Venn Diagrams?
The Harvard Crimson, 2014:
Painting
by the Numbers: Data Visualization.
The Harvard Crimson, 2014:
New
Tool
Makes Cancer Analysis More Accessible.
Harvard Medical School News, 2014:
Pattern
Recognition: New
visualization software uncovers cancer subtypes.
GenomeWeb, 2014:
Harvard TCGA Data Visualization Software Adds Tools to
Better
Characterize Disease Subtypes.
The OpenHelix Blog, 2014:
StratomeX for genomic
stratification
of
diseases.
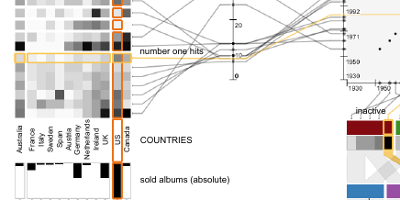
Harvard SEAS News & Harvard Gazette, 2014:
What's behind a #1 ranking?
Forbes, 2014:
Harvard And DARPA Develop Software For Deconstructing Top
100
Rankings.
Der Standard.
Heimische Forscher machen die Dynamik hinter Rankings
sichtbar.
The OpenHelix Blog, 2014
Video Tip of the Week: Entourage and enRoute from the Caleydo
team.
Nature Methods, 2013:
Data visualization: ambiguity as a
fellow
traveler.
GEN - Genetic Engineering \& Biotechnology News, 2013:
Pathway Analysis to
Decipher
Data.
Harvard SEAS News, 2013:
Celebrating minds
dedicated to discovery.
The OpenHelix Blog, 2010:
Tip of the Week: Caleydo for gene expression and pathway
visualization.
Points of view: Sets and intersections
Nature Methods, vol. 11, no. 8, pp. 779, 2014.